







Interactive Stock Charts

Interactive Stock Charts介绍
Annoucement: v2.81 includes new data source for AlphaVantage for international market data.
New!! Candlestick Pattern Scanner and Indicator Reliability Lab added to allow Instant backtesting!
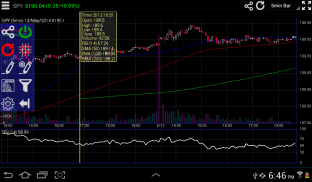
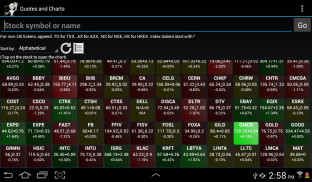
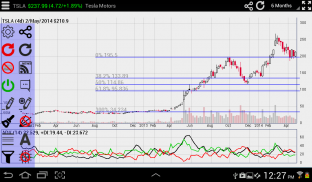
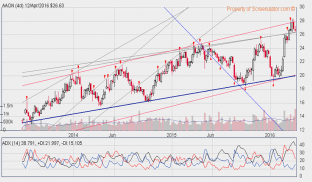
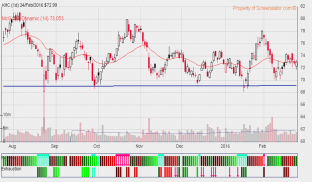
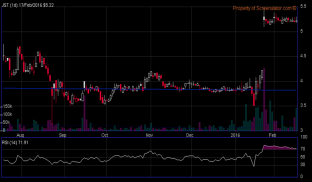
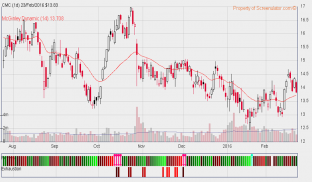
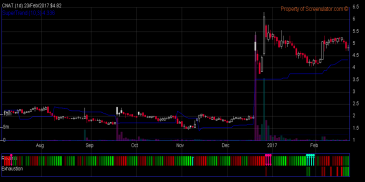
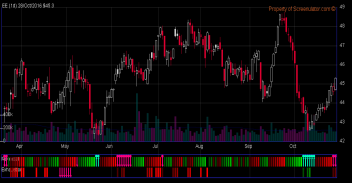
Interactive Stock Charts © is the most intuitive and advanced stock analysis charting app. You can freely adjust time frame and view technical information with touch of finger: scroll, pan and zoom on a beautiful candlestick charts with gesture and touch control. Swipe to scroll into historical analysis, pinch to zoom and change time frame, touch on price points to show detailed quotes and technical indicator values. You can also place real trade orders directly from the charts and portfolio view, through our partner Tradier Brokerage for US equity and options. Backed by Screenulator's patent pending automated chart pattern and trendline recognition engine, and industry's first 9,13 indicator completion screener! Interactive Stock Charts also comes with a powerful technical analysis tool set, Indicator Reliability Lab - in-chart backtesting tool and realtime RSS news feed to give you an edge over the market!
Using AI-based Deep Learning Neural Networks algorithms, Screenulator detects highly proftable chart patterns and reliable trendlines, TR/TD Indicators signals, as well as candlestick patterns. Backtested with 50+ years of historical big data, it ensures the you always have an edge against increasingly unpredictable markets! All Screenulator chart patterns are available on www.screenulator.com website for existing subscribers, see website for more member benefits.
Recent Additions:
Candlestick Pattern Scanner: http://www.screenulator.com/show_video.php?id=-XCcw46omgs
Indicator Reliability Lab:
About Trendlines:
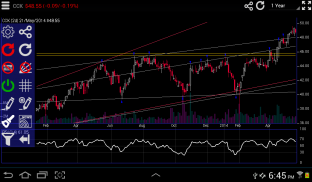
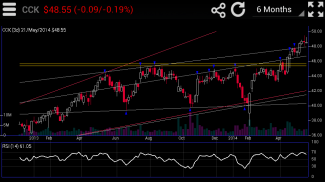
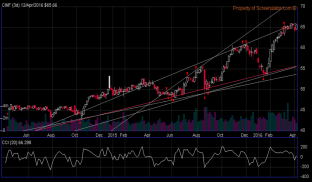
A trend line is a bounding line for the price movement of a security. A support trend line (or a bottom line) is formed when a securities price decreases and then rebounds at a pivot point that aligns with at least two previous support pivot points. Trendlines are considered by many expert traders to be the single most important tools in technical analysis. However, Support and Resistance breakout and Triangle patterns are just example of patterns formed by trendlines. This app automatically draws and screens for stocks with specific patterns.To learn more: http://www.screenulator.com/cgi-bin/v?pid=ref#trendlines
About Trend Reversal Indicator:
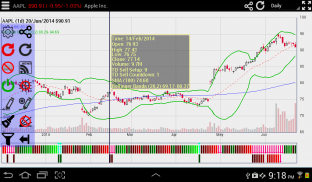
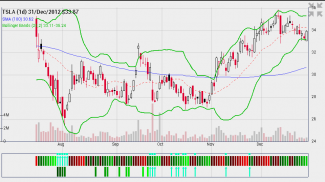
Screenulator's patent pending Trend Reversal and Exhaustion indicators combines 9,13 counting with trendline analysis to pinpoint trend pivots with color coded visual indicator. It has been shown to have an impressive record of identifying and anticipating turning points across the FX, bond, equity and commodity markets. Furthermore, the indicators provide signals not only on a daily chart but also intraday. It identifies when a trend is becoming, or has become, exhausted. This apps automatically identifies Trend Reversal, Trend Exhaustion, and Perfection criteria. It also calculates stoploss levels. To learn more: http://www.screenulator.com/show_video.php?id=TR_EXAMPLES
http://www.screenulator.com/cgi-bin/v?pid=ref#reversal
Classic TA indicators and overlays: RSI, MACD, SMA, EMA, Bollinger, Keltner band, Donchian Channel, Parabolic SAR, Ichimoku Cloud, McGinley Dynamic, SuperTrend, stochastic, ADX, Aroon, Chaikin, Ultimate, MFI, OBV, ATR, ADL, CCI indicators. Fibonacci Retracement and text annotation tools. Others will available upon requests.
Note: This app is free trial for 2 weeks or 100 usages whichever comes first.
Instruction Manual: http://www.screenulator.com/ischarts_faq.html
Desktop version: http://www.screenulator.com/ischarts_desktop.html
Annoucement:v2.81包含AlphaVantage国际市场数据的新数据源。
新!!添加烛台模式扫描仪和指示器可靠性实验室,以便即时回测!
交互式股票图表©是最直观,最先进的股票分析图表应用程序。您可以通过手指触摸自由调整时间范围和查看技术信息:使用手势和触摸控制滚动,平移和缩放美丽的烛台图表。滑动滚动到历史分析,捏合缩放和更改时间范围,触摸价格点以显示详细的报价和技术指标值。您还可以通过我们的合作伙伴Tradier Brokerage直接从图表和投资组合视图中下达实际交易订单,以获取美国股票和期权。由Screenulator正在申请专利的自动图表模式和趋势线识别引擎以及业界首个9,13指标完成筛选器提供支持!交互式股票图表还附带强大的技术分析工具集,指标可靠性实验室 - 图表回溯测试工具和实时RSS新闻源,让您在市场上占据优势!
使用基于AI的深度学习神经网络算法,Screenulator可检测高利润的图表模式和可靠的趋势线,TR / TD指标信号以及烛台模式。经过50多年的历史大数据验证,它确保您始终拥有对抗越来越难以预测的市场的优势!所有Screenulator图表模式均可在www.screenulator.com网站上获取,供现有订阅者使用,有关更多会员权益,请访问网站。
最近的补充:
烛台模式扫描仪:http://www.screenulator.com/show_video.php?id = -XCcw46omgs
指标可靠性实验室:
关于Trendlines:
趋势线是证券价格变动的边界线。当证券价格下降时形成支撑趋势线(或底线),然后在与至少两个先前支撑枢轴点对齐的枢轴点处反弹。许多专业交易者认为趋势线是技术分析中最重要的工具。但是,支撑和阻力突破以及三角形模式只是趋势线形成的模式的示例。此应用程序自动绘制和筛选具有特定模式的股票。要了解更多信息:http://www.screenulator.com/cgi-bin/v?pid = ref#trendlines
关于趋势反转指标:
Screenulator正在申请专利的Trend Reversal和Exhaustion指标结合了9,13计数和趋势线分析,通过彩色编码视觉指示器确定趋势枢轴。事实证明,它在识别和预测外汇,债券,股票和商品市场的转折点方面有着令人印象深刻的记录。此外,这些指标不仅在日线图上提供信号,而且在日内也提供信号。它确定趋势何时变得已经或已经变得疲惫不堪。此应用程序自动识别趋势反转,趋势耗尽和完美标准。它还计算止损水平。要了解更多信息,请访问:http://www.screenulator.com/show_video.php?id = TR_EXAMPLES
http://www.screenulator.com/cgi-bin/v?pid=ref#reversal
经典TA指标和叠加:RSI,MACD,SMA,EMA,Bollinger,Keltner波段,Donchian Channel,抛物线SAR,Ichimoku Cloud,McGinley Dynamic,SuperTrend,随机,ADX,Aroon,Chaikin,Ultimate,MFI,OBV,ATR,ADL ,CCI指标。 Fibonacci Retracement和文本注释工具。其他人可根据要求提供。
注意:此应用程序可免费试用2周或100次使用,以先到者为准。
使用说明书:http://www.screenulator.com/ischarts_faq.html
桌面版:http://www.screenulator.com/ischarts_desktop.html


